15.2. Create New Report
Report generation options are dynamic i.e. all reports include some widgets. Creating the report is a two step process:
1 Create the report template. 2 Add and manage the widgets in the template.
15.2.1. Create a Template
Create a new template by clicking on + Icon. You need to add the Report Name, Report category and the description.
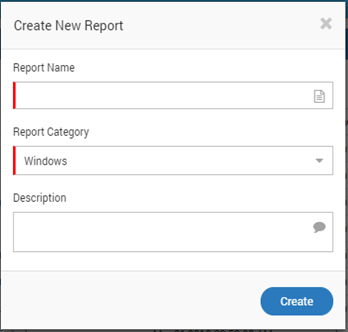
Create New Report
If the category is not available in the drop down, then simply type the name of the category. A new category will be automatically created when you click on the Create button. The template will appear as the blank template under the defined category.
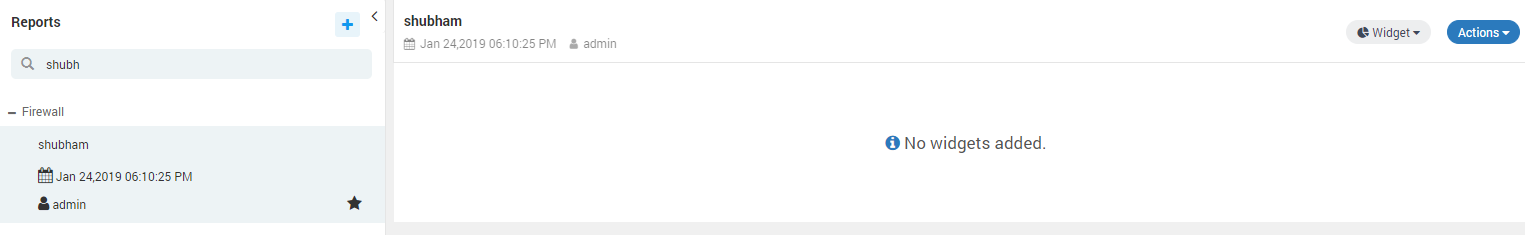
Blank Template
Once you have created a report, you need to add required widgets to the report’s dashboard.
15.2.2. Add Widgets in reports
Select Existing Widget
Search for the report and the widget you want to clone into your report
Click on the icon and then on icon. A popup will appear.
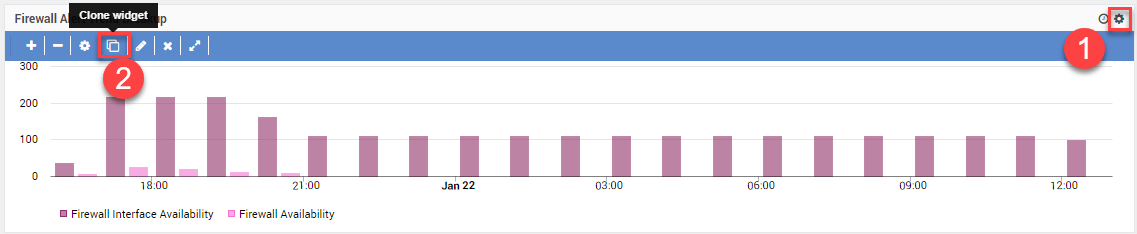
Clone Button in Widget
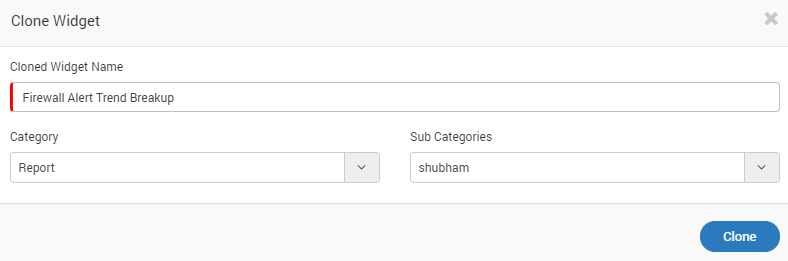
Popup for Clone Widget Settings
Change the name if you want.
In Category, select ‘Report’.
In Sub Categories, select your report.
Click ‘Clone’. The widget will appear in your report.
Widget Created by Cloning
Create a New Widget
You can create a new widget or select from existing widget. The widget can be from following types:
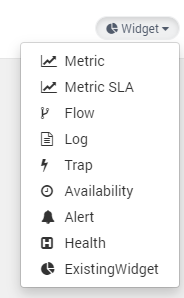
Report Widgets
Metric: The following types of views are available for Metric:
Gauge
Historical
Top N/Least N
Grid
Metric
Flow: The following types of views are available for Metric:
Gauge
Historical
Top N/Least N
Grid
Tree Map
Chord
Map
Chart
Log: The following types of views are available for Metric:
Gauge
Historical
Top N/Least N
Grid
Tree Map
Chord
Map
Log
Availability: The following types of views are available for Metric:
Gauge
Historical
Top N/Least N
Grid
Heat Map
Alert: The following types of views are available for Metric:
Gauge
Historical
Top N/Least N
Grid
Heat Map
Chart
Map
Health: Only Gauge is available.
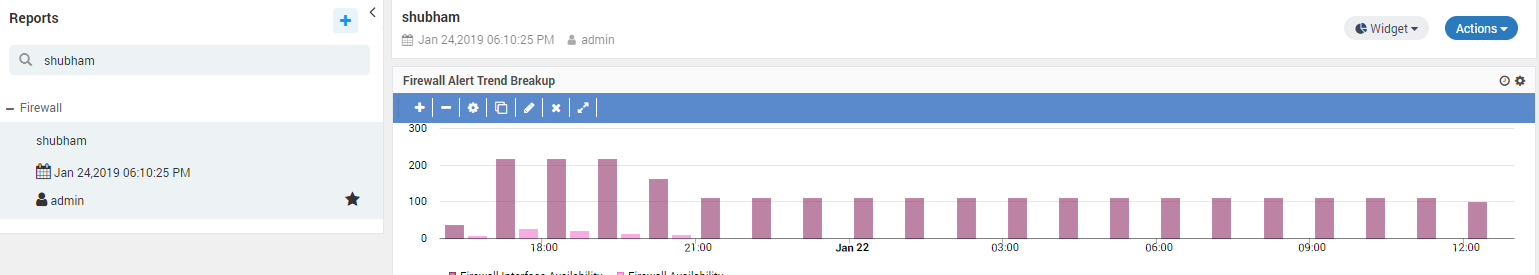
15.2.3. Example: Availability Report
You can create an availability report for the monitors to see the trend of their availability. This report has following features:
Custom Time Range: You can manage the time range of the report data in real time.
Graphical Presentation: You can create the graphical representation of data to quickly compare availability of different monitors.
Availability Trend: You can change the graph types (visualizations) in real time for analysis.
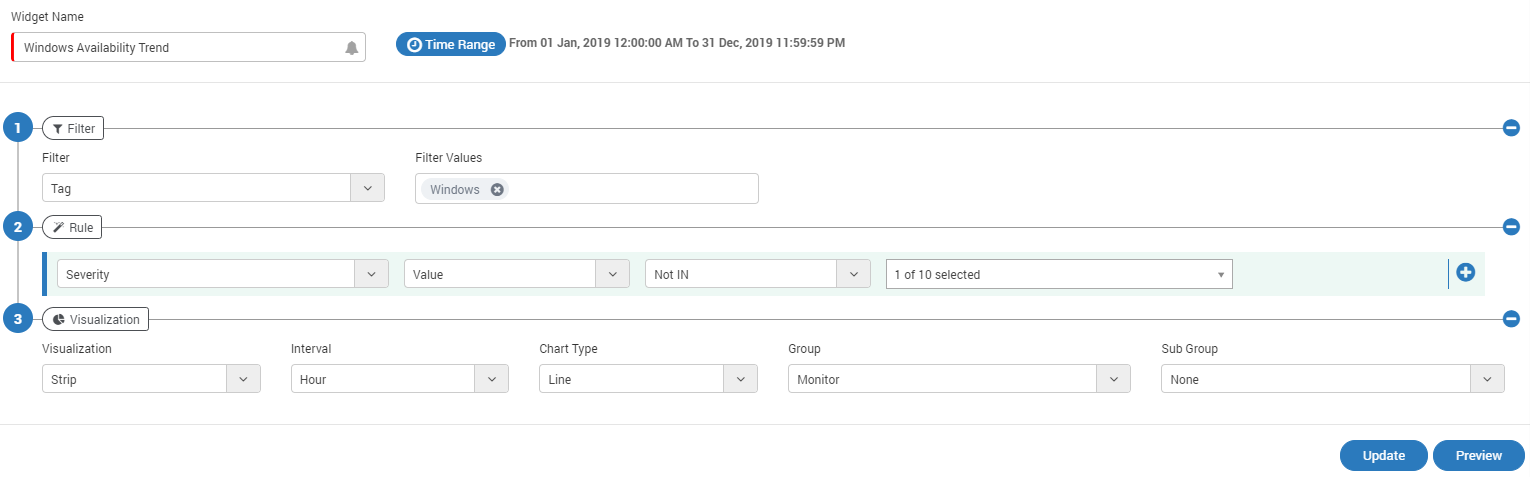
Create Availability Widget
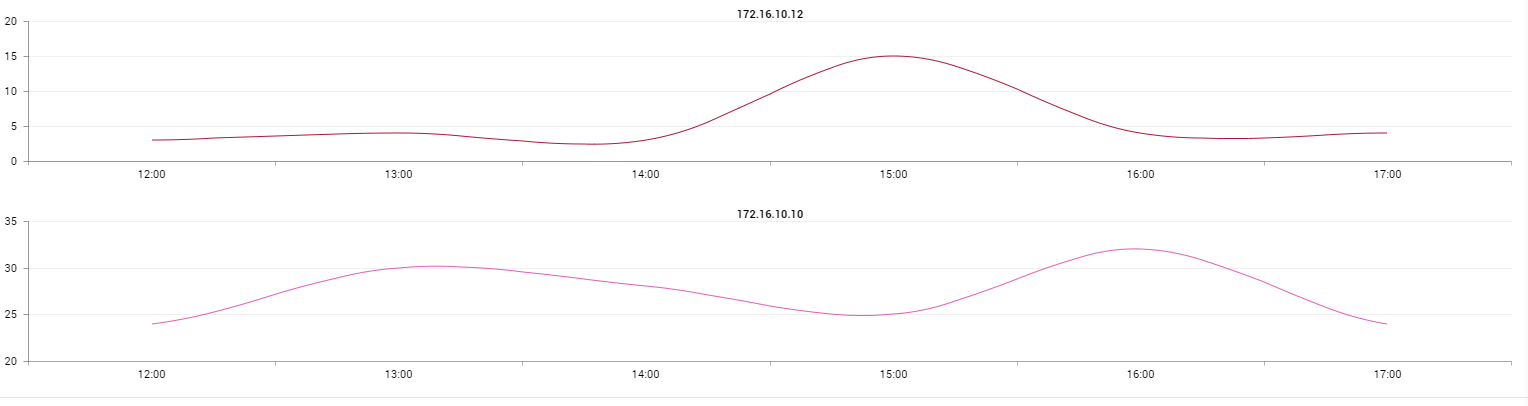
Availability Widget Example
15.2.4. Device Availability/Uptime Report Calculation
Polling Interval
The specific interval or the Polling Interval that is monitored for a device whether it is up or down is 2 minutes.
The number of polls per hour = 30
The number of polls per day = 720
Device availability calculation conditions
For Report {From Date = 2022-01-01 00:00:00 and To Date = 2022-01-31 23:00:00}
Polling Date {First Polling = 2022-01-01 00:04:00 and Last Polling = 2022-01-31 23:58:00}
Calculation
min_time = first polling time - report from date= 4 mins
[If, min_time is less than 3 mins then we consider report from date otherwise we consider first polling time So here, we are considering time as first polling time]
max_time = report to date - last polling time= 2 minutes
[If, max_time less than 3 mins then we consider report to date otherwise we consider last polling time So here, we consider time as report to date]
Thus, final time interval is (report to date - first polling time)
Note: We have taken constant 3 mins time difference to decide whether to consider(while calculating time) report from/to date or first/last poll time (2 mins for standard availability + 1 min for buffer). If considered in worst conditions, the observed time difference maximum will reach to 6 mins in total time.
3600 seconds = 1 hour
86400 seconds = 24 hours
Report Calculation Formula
Availability Percentage = (Uptime Count) / (Total Count) * 100
Down percentage = (Downtime Count) / (Total Count) * 100
To calculate node availability count over a selected time period, the sum of all Polling Response Count for the mentioned node over the selected time period is divided by the selected time period. This provides an average availability over the selected time period. It must be noted that the availability duration is derived from the percentage and not vice-versa. The system calculates the average up and down percentage over a given time period, and is a standard practice amongst the most notable Network Monitoring Systems.
Notes:
If any difference is observed in decimal values, it will get added automatically to the difference in Uptime.
Time will be stored in seconds for both hourly and daily calculation.
Here, calculation of time is based on percentage. Thus, the sum amount of time of two months individually (manually) will not be equal to the sum of the two whole months.